
Homes for sale
3
Active inventory on the update date
Indian Harbour Beach, Florida · Neighborhood market report
See what is available, what has sold and how quickly properties are moving in Somerset Oceanfront Condo. Compare asking prices with actual closing prices below.
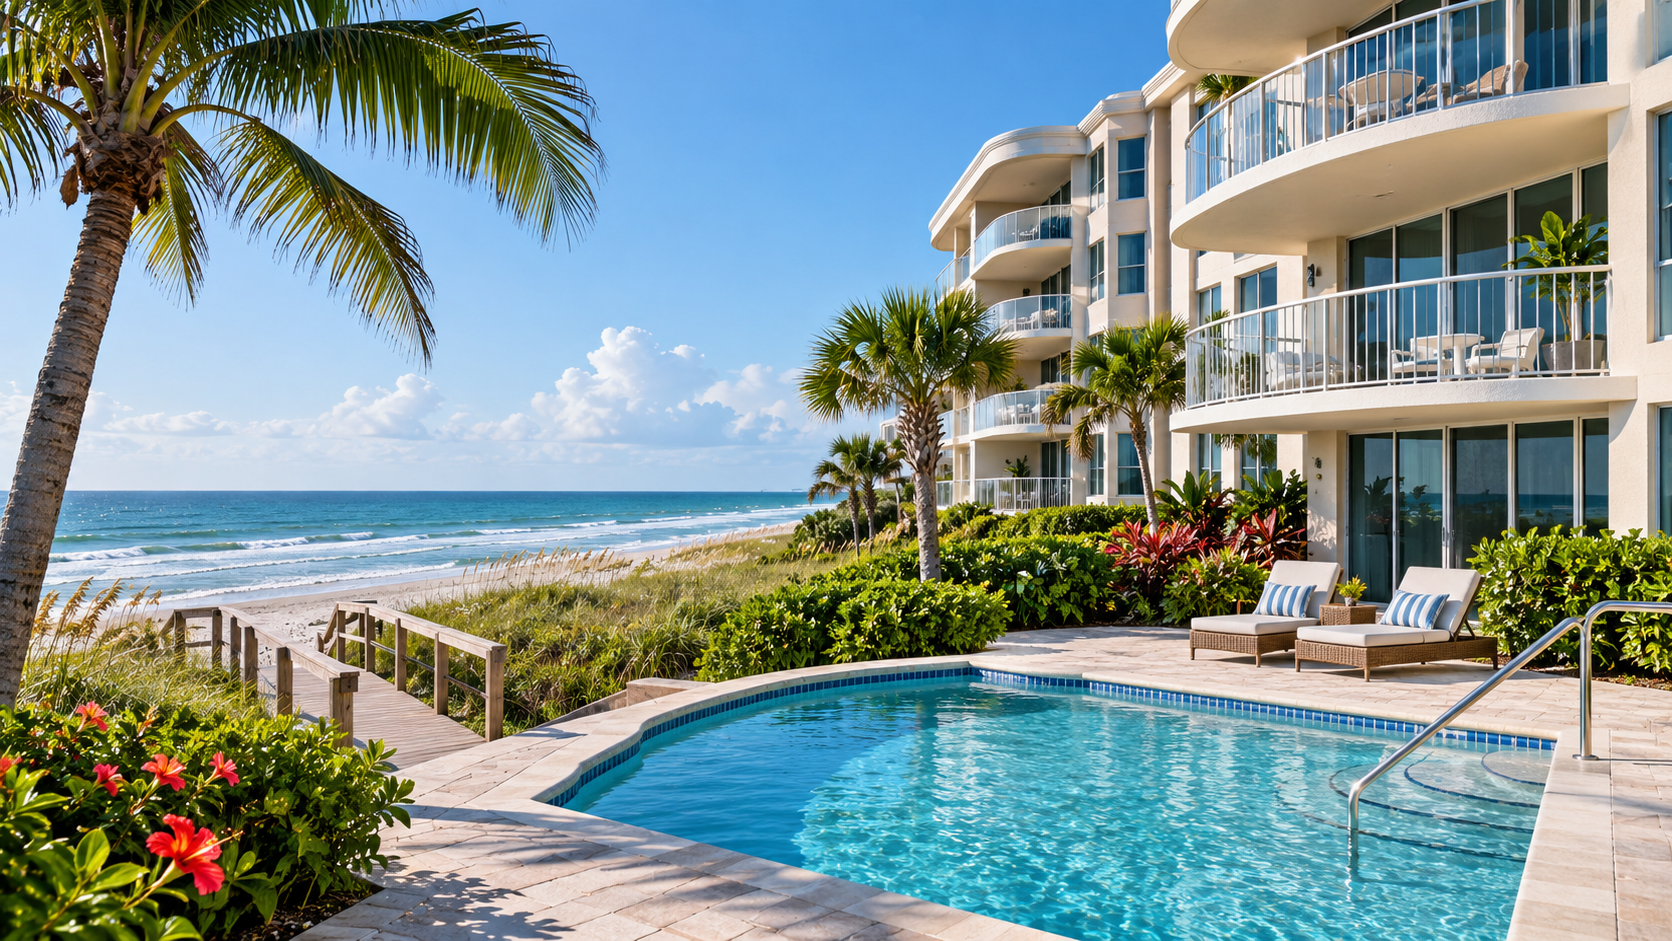
3
Active inventory on the update date
0
Pending listings on the update date
6
Based on the trailing 6-month sales pace
3
Trailing 6 months; 8 in 12 months
$938,500
Trailing 12 months; 8 sale events
134 days
Closed listings; trailing 12 months
97.2%
Sale price / displayed final list price
$810,000
Active listings; separate from sale prices
There were 0 closed sales in Aug-Oct 2026 and 3 in May-Jul 2026. At least one comparison period has fewer than 10 sales, so the sample is too small for a confident market-direction label. Longer reporting periods are more useful here.
There are 3 active listings against 0.5 closings per month over the trailing six months. That equals approximately 6 months of supply at that pace. Individual home condition, size and pricing still matter.
Six completed calendar months. Current partial month excluded.
A quieter month alone does not establish a trend.
Explore current listings and recent closed sales in Somerset Oceanfront Condo, grouped under Indian Harbour Beach in our directory. This report follows the exact MLS subdivision shown in the methodology.
Compare similar properties and check the number of sales behind each statistic. A few closings can shift the median substantially.
Example MLS property record · Request a property-specific comparison
Expired listings: this public feed exposes active, pending and sold records. Expired counts and properties are unavailable and are not inferred from homes disappearing from the market.
Active homes, properties under contract and closed sales follow below. The native sold-table badge labeled "Avg. Listing Price" describes asking prices; use the Sold Price column for closing prices. Native statistics are averages; the summary above explicitly labels its medians.
| Address | Beds | Baths | Living ft2 | List Price | Cost per ft2 | DOM |
|---|---|---|---|---|---|---|
| 2075 Jimmy Buffett Mem Highway | 3 | 2 | 1,832 | $829,000 | $452 | 4 days |
| 2095 Highway A1a Highway Unit 4403 | 3 | 2 | 1,832 | $810,000 | $442 | 82 days |
| 2095 Highway A1a Highway Unit 4703 | 3 | 2 | 1,832 | $799,000 | $436 | 84 days |
| Average: | 3.0 | 2.0 | 1,832 | $812,666 | $443 | 57 days |
|
Viewing 1 - 3 of 3
|
| Address | Beds | Baths | Living ft2 | List Price | Sold Price | Cost per ft2 | DOM | Sold Date |
|---|---|---|---|---|---|---|---|---|
| 2075 Highway A1a Highway | 3 | 3 | 2,225 | $1,225,000 | $1,140,000 | $512 | 34 days | 7/23/26 |
| 2075 Highway A1a Highway | 3 | 3 | 2,225 | $860,000 | $786,000 | $353 | 56 days | 6/26/26 |
| 2065 Highway A1a | 3 | 3 | 2,578 | $975,000 | $948,000 | $367 | 127 days | 5/20/26 |
| 2095 Highway A1a Highway | 3 | 2 | 1,832 | $819,900 | $800,000 | $436 | 141 days | 3/12/26 |
| 2075 Highway A1a | 3 | 3 | 2,225 | $949,000 | $929,000 | $417 | 42 days | 2/24/26 |
| 2085 Highway A1a Highway Unit 3204 | 3 | 3 | 2,225 | $899,900 | $875,000 | $393 | 249 days | 2/11/26 |
| 2075 Highway A1A Highway Unit 2302 | 3 | 3 | 2,225 | $1,100,000 | $1,025,000 | $460 | 349 days | 2/11/26 |
| 2075 Highway A1A | 3 | 3 | 2,578 | $1,000,000 | $990,000 | $384 | 146 days | 12/17/25 |
| Average: | 3.0 | 2.9 | 2,264 | $978,600 | $936,625 | $415 | 143 days | |
|
Viewing 1 - 8 of 8
|