
Homes for sale
20
Active inventory on the update date
Palm Bay, Florida · Neighborhood market report
See what is available, what has sold and how quickly properties are moving in Cypress Bay. Compare asking prices with actual closing prices below.
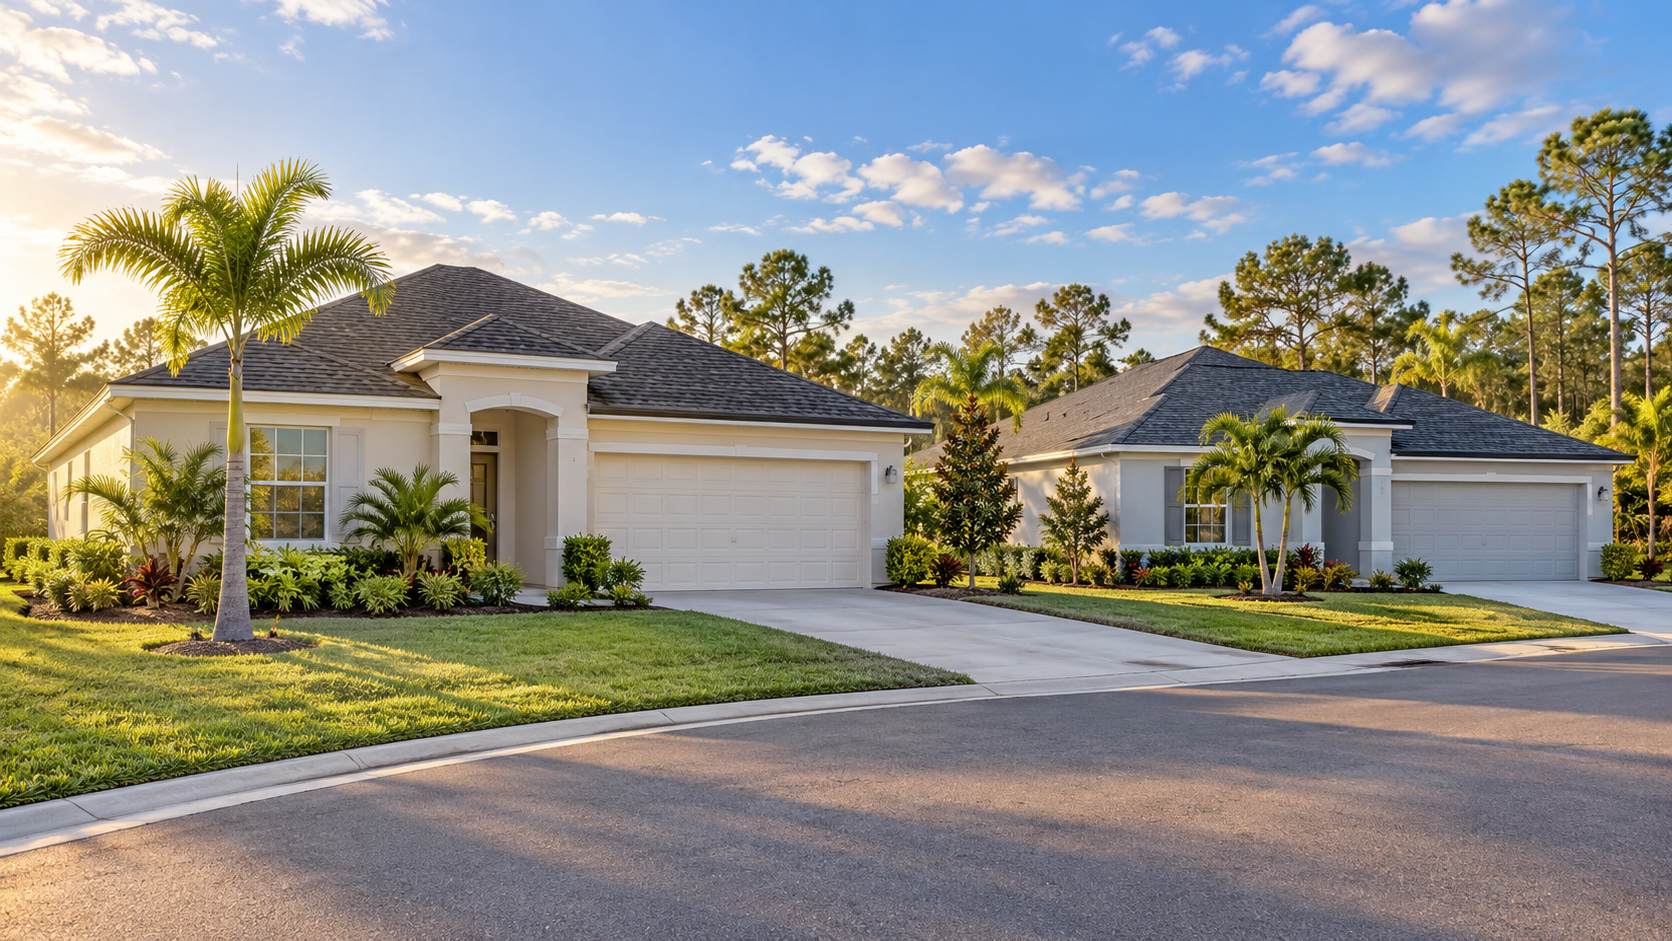
20
Active inventory on the update date
3
Pending listings on the update date
2
Based on the trailing 6-month sales pace
59
Trailing 6 months; 110 in 12 months
$349,995
Trailing 12 months; 110 sale events
105 days
Closed listings; trailing 12 months
98.6%
Sale price / displayed final list price
$344,415
Active listings; separate from sale prices
Closed-sale activity decreased: 28 sales in Aug-Oct 2026, compared with 31 in May-Jul 2026 (-9.7%). Median selling time was 90 days versus 95 days. These measures describe recent activity; they do not establish a price trend or predict future values.
There are 20 active listings against 9.8 closings per month over the trailing six months. That equals approximately 2 months of supply at that pace. Individual home condition, size and pricing still matter.
Six completed calendar months. Current partial month excluded.
A quieter month alone does not establish a trend.
Duplicate MLS record adjustment: The native sold table contains 111 listing records. After a review of the public property details, 1 duplicate closing record was removed from the summary calculations, leaving 110 distinct sale events. For 1403 Garabaldi Circle SE, both records show the same closing date and price; the broker-listed record's 91 days on market is used rather than the separate non-MLS record's 0 days. Native listing tables remain as supplied by the feed.
This Palm Bay report combines the recorded Cypress Bay West, Cypress Bay West Freedom and Cypress Bay Preserve phases listed in the methodology. It is a combined area report, so its totals are broader than any one phase.
Compare builder inventory and resale homes separately when choosing comparable properties. Builder incentives, association charges and any district assessments require property-specific confirmation.
D.R. Horton Cypress Bay West community information · Request a property-specific comparison
Expired listings: this public feed exposes active, pending and sold records. Expired counts and properties are unavailable and are not inferred from homes disappearing from the market.
Active homes, properties under contract and closed sales follow below. The native sold-table badge labeled "Avg. Listing Price" describes asking prices; use the Sold Price column for closing prices. Native statistics are averages; the summary above explicitly labels its medians.
| Address | Beds | Baths | Living ft2 | List Price | Cost per ft2 | DOM |
|---|---|---|---|---|---|---|
| 2013 Capital Drive SE | 4 | 2 | 1,830 | $488,900 | $267 | 81 days |
| 1644 Garabaldi Circle SE | 5 | 3 | 2,601 | $419,000 | $161 | 132 days |
| 1864 Capital Drive SE | 5 | 3 | 2,674 | $415,000 | $155 | 123 days |
| 1026 Dugan Circle SE | 5 | 3 | 2,626 | $399,000 | $151 | 21 days |
| 1191 Mandrake Lane SE | 4 | 2 | 2,034 | $389,080 | $191 | 84 days |
| 1172 Mandrake Lane SE | 4 | 2 | 2,034 | $379,990 | $186 | 84 days |
| 1181 Mandrake Lane SE | 3 | 2 | 1,816 | $366,980 | $202 | 84 days |
| 1723 Garabaldi Circle SE | 4 | 2 | 1,828 | $349,000 | $190 | 232 days |
| 3747 Aberdeen Drive SE | 4 | 2 | 1,828 | $344,900 | $188 | 30 days |
| 1252 Mandrake Lane SE | 4 | 2 | 1,665 | $344,830 | $207 | 84 days |
| 1614 Garabaldi Circle SE | 3 | 2 | 1,672 | $344,000 | $205 | 161 days |
| 1201 Mandrake Lane SE | 3 | 2 | 1,714 | $339,990 | $198 | 84 days |
| 3631 Peony Court SE | 4 | 2 | 1,846 | $335,000 | $181 | 316 days |
| 1814 Farmhouse Road SE | 4 | 2 | 1,830 | $334,900 | $183 | 88 days |
| 1743 Garabaldi Circle SE | 3 | 2 | 1,672 | $329,000 | $196 | 128 days |
| 4132 Faraday Place SE | 4 | 2 | 1,665 | $328,460 | $197 | 84 days |
| 2173 Farmhouse Road SE | 4 | 2 | 1,918 | $325,000 | $169 | 21 days |
| 3597 Aberdeen Drive SE | 4 | 2 | 1,830 | $325,000 | $177 | 42 days |
| 1863 Farmhouse Road SE | 4 | 2 | 2,046 | $325,000 | $158 | 266 days |
| 3773 Coachman Lane SE | 4 | 2 | 1,830 | $322,000 | $175 | 24 days |
| Average: | 4.0 | 2.1 | 1,947 | $360,251 | $187 | 109 days |
|
Viewing 1 - 20 of 20
|
| Address | Beds | Baths | Living ft2 | List Price | Cost per ft2 | DOM |
|---|---|---|---|---|---|---|
| 1222 Mandrake Lane SE | 3 | 2 | 1,816 | $369,000 | $203 | 84 days |
| 1674 Garabaldi Circle SE | 4 | 2 | 1,828 | $341,000 | $186 | 128 days |
| 4142 Faraday Place SE | 3 | 2 | 1,504 | $313,185 | $208 | 20 days |
| Average: | 3.3 | 2.0 | 1,716 | $341,061 | $199 | 78 days |
|
Viewing 1 - 3 of 3
|
| Address | Beds | Baths | Living ft2 | List Price | Sold Price | Cost per ft2 | DOM | Sold Date |
|---|---|---|---|---|---|---|---|---|
| 3621 Peony Court SE | 5 | 3 | 2,674 | $469,000 | $469,000 | $175 | 85 days | 1/7/26 |
| 1046 Dugan Circle SE | 5 | 3 | 2,626 | $449,000 | $449,000 | $170 | 58 days | 7/2/26 |
| 2013 Farmhouse Road SE | 4 | 2 | 1,830 | $440,000 | $445,000 | $243 | 24 days | 12/1/25 |
| 1534 Garabaldi Circle SE | 5 | 3 | 2,601 | $434,705 | $420,000 | $161 | 119 days | 8/31/26 |
| 1453 Garabaldi Circle SE | 5 | 3 | 2,601 | $432,125 | $414,500 | $159 | 128 days | 4/23/26 |
| 1414 Garabaldi Circle SE | 5 | 3 | 2,601 | $414,940 | $412,440 | $158 | 101 days | 3/27/26 |
| 3739 Maya Place SE | 5 | 3 | 2,601 | $414,990 | $409,990 | $157 | 103 days | 3/23/26 |
| 1873 Farmhouse Road SE | 5 | 3 | 2,674 | $425,000 | $409,000 | $152 | 76 days | 7/27/26 |
| 1483 Garabaldi Circle SE | 5 | 3 | 2,077 | $399,935 | $401,035 | $193 | 175 days | 6/9/26 |
| 2083 Farmhouse Road SE | 4 | 2 | 1,918 | $398,000 | $396,000 | $206 | 69 days | 2/12/26 |
| 1524 Garabaldi Circle SE | 5 | 3 | 2,077 | $395,935 | $395,935 | $190 | 93 days | 8/5/26 |
| 1654 Garabaldi Circle SE | 5 | 3 | 2,077 | $390,000 | $390,000 | $187 | 83 days | 9/16/26 |
| 4091 Hollingsworth Drive SE | 4 | 2 | 2,034 | $439,990 | $386,990 | $190 | 127 days | 9/25/26 |
| 4101 Hollingsworth Drive SE | 4 | 2 | 2,034 | $384,990 | $384,990 | $189 | 50 days | 9/29/26 |
| 4031 Hollingsworth Drive SE | 4 | 2 | 2,034 | $393,435 | $384,000 | $188 | 118 days | 12/12/25 |
| 4001 Hollingsworth Drive SE | 4 | 2 | 2,034 | $387,435 | $382,435 | $188 | 86 days | 11/10/25 |
| 1653 Garabaldi Circle SE | 5 | 3 | 2,077 | $389,935 | $381,000 | $183 | 83 days | 9/16/26 |
| 4041 Hollingsworth Drive SE | 4 | 2 | 2,034 | $389,990 | $380,900 | $187 | 154 days | 6/8/26 |
| 1292 Mandrake Lane SE | 4 | 2 | 2,034 | $382,435 | $379,735 | $186 | 105 days | 3/31/26 |
| 1202 Mandrake Lane SE | 4 | 2 | 2,034 | $377,990 | $377,990 | $185 | 49 days | 9/28/26 |
| 1404 Garabaldi Circle SE | 5 | 3 | 2,077 | $374,000 | $374,000 | $180 | 101 days | 3/27/26 |
| 1615 Criswell Lane SE | 4 | 2 | 2,034 | $367,435 | $371,125 | $182 | 137 days | 5/22/26 |
| 4011 Hollingsworth Drive SE | 3 | 2 | 1,816 | $373,590 | $371,040 | $204 | 151 days | 1/20/26 |
| 1434 Garabaldi Circle SE | 5 | 3 | 2,077 | $389,990 | $370,000 | $178 | 105 days | 3/31/26 |
| 4040 Hollingsworth Drive SE | 4 | 2 | 2,034 | $374,435 | $369,805 | $181 | 171 days | 3/25/26 |
| 1604 Garabaldi Circle SE | 4 | 2 | 1,828 | $368,000 | $368,000 | $201 | 77 days | 8/24/26 |
| 3940 Hollingsworth Drive SE | 4 | 2 | 2,034 | $375,435 | $368,000 | $180 | 136 days | 11/7/25 |
| 4000 Hollingsworth Drive SE | 4 | 2 | 2,034 | $367,435 | $367,435 | $180 | 83 days | 11/7/25 |
| 1625 Criswell Lane SE | 4 | 2 | 2,034 | $366,580 | $366,580 | $180 | 0 days | 6/18/26 |
| 1554 Garabaldi Circle SE | 4 | 2 | 1,828 | $364,000 | $364,000 | $199 | 79 days | 8/5/26 |
| 1473 Garabaldi Circle SE | 4 | 2 | 1,828 | $361,000 | $361,000 | $197 | 91 days | 6/1/26 |
| 1463 Garabaldi Circle SE | 4 | 2 | 1,828 | $367,000 | $360,450 | $197 | 74 days | 5/15/26 |
| 2243 Capital Drive | 4 | 2 | 1,830 | $375,000 | $360,000 | $196 | 90 days | 7/2/26 |
| 1583 Garabaldi Circle SE | 4 | 2 | 1,828 | $360,000 | $360,000 | $196 | 136 days | 7/29/26 |
| 1454 Garabaldi Circle SE | 4 | 2 | 1,828 | $359,990 | $359,990 | $196 | 90 days | 6/16/26 |
| 1363 Garabaldi Circle SE | 4 | 2 | 1,828 | $359,990 | $359,990 | $196 | 149 days | 12/4/25 |
| 1624 Garabaldi Circle SE | 4 | 2 | 1,828 | $362,000 | $359,000 | $196 | 99 days | 9/22/26 |
| 3759 Maya Place SE | 3 | 2 | 1,672 | $359,000 | $359,000 | $214 | 160 days | 8/25/26 |
| 4020 Hollingsworth Drive SE | 4 | 2 | 2,034 | $364,435 | $358,385 | $176 | 145 days | 2/27/26 |
| 1563 Garabaldi Circle SE | 4 | 2 | 1,828 | $358,000 | $358,000 | $195 | 107 days | 6/30/26 |
| 1493 Garabaldi Circle SE | 4 | 2 | 1,828 | $359,000 | $357,800 | $195 | 107 days | 6/17/26 |
| 985 Dugan Circle SE | 4 | 2 | 1,830 | $349,900 | $357,000 | $195 | 99 days | 3/31/26 |
| 1393 Garabaldi Circle SE | 4 | 2 | 1,828 | $357,000 | $357,000 | $195 | 146 days | 3/16/26 |
| 1553 Garabaldi Circle SE | 4 | 2 | 1,828 | $361,000 | $356,000 | $194 | 128 days | 7/21/26 |
| 2193 Capital Drive SE | 4 | 2 | 2,046 | $350,000 | $355,000 | $173 | 45 days | 6/29/26 |
| 1403 Garabaldi Circle SE | 4 | 2 | 1,828 | $354,990 | $354,990 | $194 | 0 days | 3/11/26 |
| 1634 Garabaldi Circle SE | 4 | 2 | 1,828 | $364,990 | $354,990 | $194 | 98 days | 9/21/26 |
| 1423 Garabaldi Circle SE | 4 | 2 | 1,828 | $359,990 | $354,990 | $194 | 101 days | 3/27/26 |
| 1403 Garabaldi Circle SE | 4 | 2 | 1,828 | $354,990 | $354,990 | $194 | 91 days | 3/11/26 |
| 1523 Garabaldi Circle SE | 4 | 2 | 1,828 | $356,000 | $354,765 | $194 | 109 days | 7/2/26 |
| Average: | 3.9 | 2.1 | 1,895 | $360,780 | $355,407 | $188 | 118 days | |
|
Viewing 1 - 50 of 111
Next
|